
티스토리 뷰
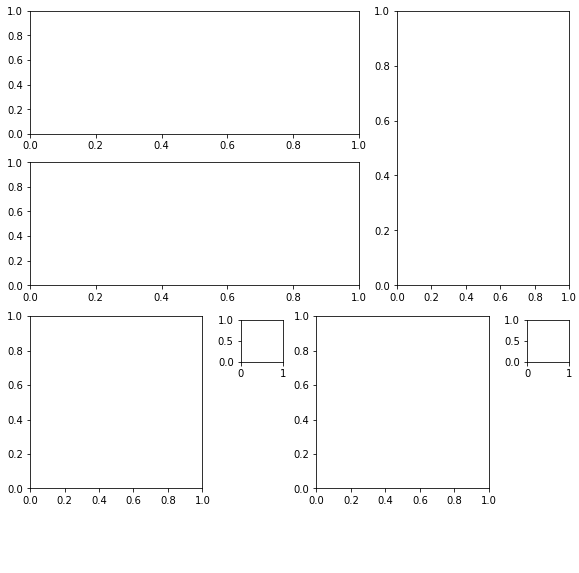
데이터 시각화를 위해 다음과 같이 7개의 subplot을 만들었다.
각 subplot의 위치와 크기를 지정하는데에 고생하였다.
|
1
2
3
4
5
6
7
8
9
10
11
12
13
14
15
|
from matplotlib import pyplot as plt
fig = plt.figure(constrained_layout = True, figsize=(8,8))
gs = fig.add_gridspec(8,8)
ax1 = fig.add_subplot(gs[0:2,0:5])
ax2 = fig.add_subplot(gs[0:4,5:])
ax3 = fig.add_subplot(gs[2:4,0:5])
ax4 = fig.add_subplot(gs[4:7,0:3],aspect = 'equal')
ax5 = fig.add_subplot(gs[4,3],aspect = 'equal')
ax6 = fig.add_subplot(gs[4:7,4:7],aspect = 'equal')
ax7 = fig.add_subplot(gs[4,7],aspect = 'equal')
plt.show()
|
cs |
이중 왼쪽위의 subplot (ax1)에 두 개의 축을 가진 그래프를 그리고 각 그래프의 보여지는 우선순위(포토샵의 레이어 개념, 파워포인트의 맨앞으로 같은 정렬 개념)을 조정할 필요가 있었으나 zorder가 작동되지 않는다.
|
1
2
3
4
5
6
7
8
9
10
11
12
13
14
15
16
17
18
19
20
21
22
23
|
from matplotlib import pyplot as plt
fig = plt.figure(constrained_layout = True, figsize=(8,8))
gs = fig.add_gridspec(8,8)
ax1 = fig.add_subplot(gs[0:2,0:5])
ax2 = fig.add_subplot(gs[0:4,5:])
ax3 = fig.add_subplot(gs[2:4,0:5])
ax4 = fig.add_subplot(gs[4:7,0:3],aspect = 'equal')
ax5 = fig.add_subplot(gs[4,3],aspect = 'equal')
ax6 = fig.add_subplot(gs[4:7,4:7],aspect = 'equal')
ax7 = fig.add_subplot(gs[4,7],aspect = 'equal')
x = [1,2,3,4,5]
y1 = [1,2,3,2,1]
y2 = [20,20,20,20,20]
ax1.plot(x,y1, color = 'r',linewidth = 10, zorder = 1)
ax1_1 = ax1.twinx()
ax1_1.plot(x,y2,color = 'grey',linewidth = 10, zorder = -1)
plt.show()
|
cs |
19번 줄에서 빨간선을 그었고 zorder는 1로 지정하였다.
21번줄에서 같은 subplot안에서 다른 축을 가지는 회색선 그래프를 그렸고 zorder는 -1로 지정하였다.
zorder가 클수록 우선순위가 높고 더 위쪽으로 보여지기 때문에 빨간선이 위쪽으로 나올 것이라고 생각했으나 그렇지 않았다.
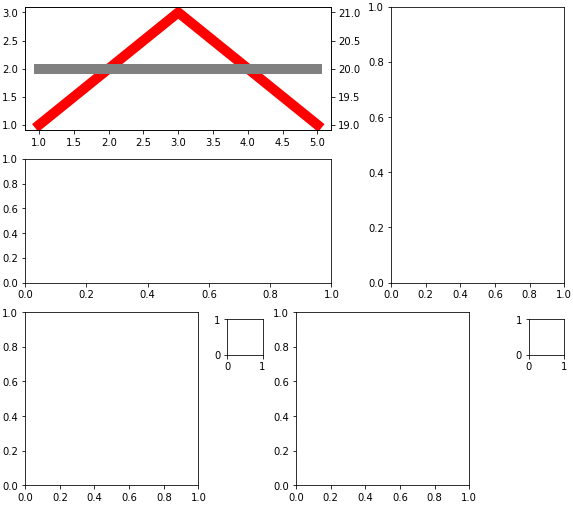
보이는 것 처럼 회색선이 위쪽에 있다. zorder가 작동하지 않은것이다.
그래서 zorder를 설정하는 다른방법으로 ax.set_zorder를 사용하였다.
|
1
2
3
4
5
6
7
8
9
10
11
12
13
14
15
16
17
18
19
20
21
22
23
24
25
|
from matplotlib import pyplot as plt
fig = plt.figure(constrained_layout = True, figsize=(8,8))
gs = fig.add_gridspec(8,8)
ax1 = fig.add_subplot(gs[0:2,0:5])
ax2 = fig.add_subplot(gs[0:4,5:])
ax3 = fig.add_subplot(gs[2:4,0:5])
ax4 = fig.add_subplot(gs[4:7,0:3],aspect = 'equal')
ax5 = fig.add_subplot(gs[4,3],aspect = 'equal')
ax6 = fig.add_subplot(gs[4:7,4:7],aspect = 'equal')
ax7 = fig.add_subplot(gs[4,7],aspect = 'equal')
x = [1,2,3,4,5]
y1 = [1,2,3,2,1]
y2 = [2,2,2,2,2]
ax1.plot(x,y1, color = 'r',linewidth = 10)
ax1_1 = ax1.twinx()
ax1_1.plot(x,y2,color = 'grey',linewidth = 10)
ax1.set_zorder(1)
ax1_1.set_zorder(-1)
plt.show()
|
cs |
그러나 그 결과는 다음과 같이 회색선이 사라져 버린다. 그 이유는 그래프의 바탕 기본값이 흰색이라 안보이는 듯 하다..
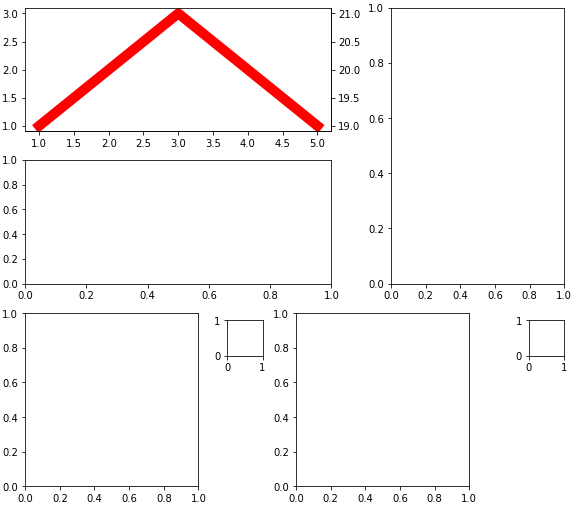
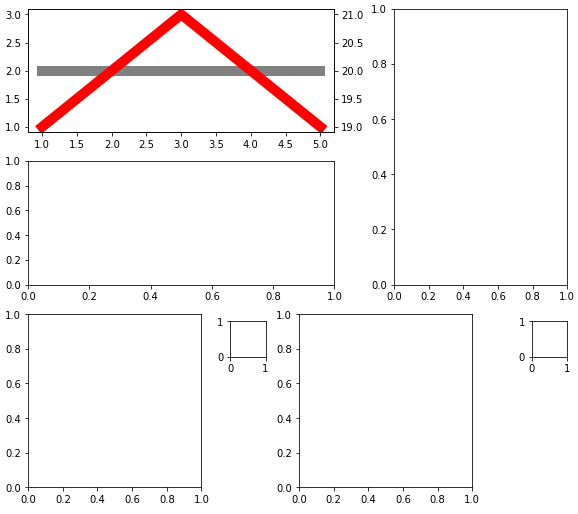
그래서 강제로 그래프 배경을 투명하게 만든다. ax.patch.set_visible(False)를 이용한다.
최종 코드와 결과물은 아래와 같다.
|
1
2
3
4
5
6
7
8
9
10
11
12
13
14
15
16
17
18
19
20
21
22
23
24
25
26
|
from matplotlib import pyplot as plt
fig = plt.figure(constrained_layout = True, figsize=(8,8))
gs = fig.add_gridspec(8,8)
ax1 = fig.add_subplot(gs[0:2,0:5])
ax2 = fig.add_subplot(gs[0:4,5:])
ax3 = fig.add_subplot(gs[2:4,0:5])
ax4 = fig.add_subplot(gs[4:7,0:3],aspect = 'equal')
ax5 = fig.add_subplot(gs[4,3],aspect = 'equal')
ax6 = fig.add_subplot(gs[4:7,4:7],aspect = 'equal')
ax7 = fig.add_subplot(gs[4,7],aspect = 'equal')
x = [1,2,3,4,5]
y1 = [1,2,3,2,1]
y2 = [2,2,2,2,2]
ax1.plot(x,y1, color = 'r',linewidth = 10)
ax1_1 = ax1.twinx()
ax1_1.plot(x,y2,color = 'grey',linewidth = 10)
ax1.set_zorder(1)
ax1_1.set_zorder(-1)
ax1.patch.set_visible(False)
plt.show()
|
cs |
'digitalization > 파이썬' 카테고리의 다른 글
| 스파이더의 variable explorer(변수목록)에서 모든 변수가 보이지 않을 경우 (0) | 2020.03.12 |
|---|---|
| 파이썬에서 바이너리 파일, 이미지(빅 에디안) 불러오기 (0) | 2019.08.02 |
댓글